I wanted to know which parts of Panackelty's compiler and standard library our tests actually run. That's a slightly unusual problem because the compiler is self-hosted: it's written in Panackelty, the language it compiles. I can measure that .panack source with Panackelty's own compiler and virtual machine.
But printing a percentage is the easy part. I need to know what was eligible to count, which test runs contributed evidence, and where the report couldn't tell what happened. Without that, a tidy number can give a misleading impression of how much we tested.
The machinery I built is particular to a compiler, its bytecode and its bootstrap process. Most projects don't need it. The questions behind it apply more widely, though: what does the report include, what did the tests do, and how much can I trust the result?
Coverage tells me what ran
Coverage records execution. It doesn't tell me whether a test checked the result. Assertions and other checks do that.
Suppose a function returns different text for values of at least ten and values below ten:
pure classify(value: Nat): Str {
  if value >= 10 {
    "large"
  } else {
    "small"
  }
}
A test that calls classify(12) tells me the function ran, the condition was evaluated and the true outcome was taken. It tells me nothing about the false outcome. And a test could take both paths without checking that either returned the right text.
Coverage helps me ask, “Did this path run?” It can't answer, “Would the test notice if the path were wrong?” For that I need an assertion, a checked transcript, a mutation check or some other behavioural evidence.
Why measure Panackelty source?
Native C coverage measures parts of the virtual machine and host implementation. That's useful, but it doesn't show me what ran in the compiler and standard library written in .panack. The source report fills that gap.
I can use it to see whether a compiler error path ran, whether tests exercised both sides of a standard-library condition, or whether a function was never reached by the measured tests. Those gaps give me questions to investigate. Is a test missing? Is the code unreachable? Was the test left out of the measured corpus? Or couldn't the collector connect the execution to its source? Each answer calls for a different response.
First decide what can count
Before tests run, Panackelty builds a source inventory: a map of eligible source items and their locations. The compiler creates it from parsed source, before lowering that source to bytecode.
That timing matters. One if in a Panackelty program can become several bytecode instructions. If I counted those instructions, the report would reflect how the compiler implemented the decision, rather than the decision the programmer wrote. The inventory records source-level items instead: functions, expressions, statements, decisions and their possible outcomes.
I include functions even when the measured tests never call them. Otherwise, unused production code could drop out of the denominator and make the percentage look better. The inventory also lists exclusions with reasons. Imports, type declarations, record and enum declarations, and compile-time refinement checks don't execute as runtime source, so I don't count them as uncovered code.
The inventory only tells me what could be measured. The execution evidence comes later.
What the source measures mean
Panackelty reports three measures, each with its own denominator:
- Lines: unique source lines where an eligible expression or statement starts. A multi-line expression doesn't make every line it spans executable. Function headers, punctuation and excluded declarations don't add executable lines.
- Functions: original source declarations, including functions the tests never enter. Generic functions keep one source identity even when callers use different type arguments.
- Source outcomes: choices in the source, such as the true or false side of an
if, evaluating or skipping the right side of&&or||, entering or leaving a loop, and selecting amatcharm. These aren't incidental branches introduced when the compiler lowers code for the VM.
For line coverage, reaching the line where an expression starts doesn't mean every line in a multi-line expression ran. I keep that distinction explicit in the report.
How an execution becomes a source observation
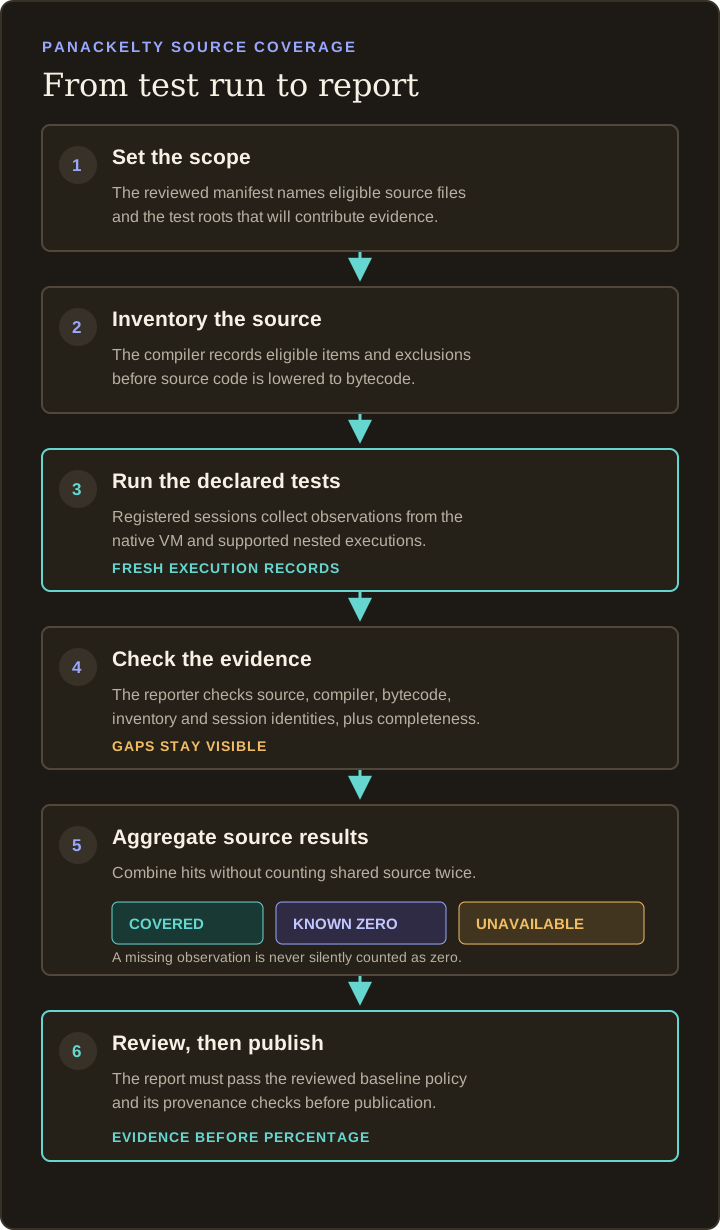
The report has to connect the source inventory to the runs that produced it. This is how I do that:
- Set the scope. A reviewed manifest names the eligible source files and test roots.
- Register the executions. A coverage session records the compiled programs and inventories that may run, including supported nested VM and child-process executions.
- Collect observations. With coverage enabled, the native VM records counters as instructions and functions run. Ordinary execution doesn't allocate these counters or write coverage files.
- Check the identities. The self-hosted compiler tooling recreates the source inventory and probes. A bounded reader checks each record against the local compiler, source, bytecode and inventory identities before accepting it.
- Combine the sessions. The aggregator checks that expected executions registered, that their records belong to this session, and that the records form a complete, consistent set. It combines hits for the same source item without counting shared files twice in the denominator.
- Review and publish. The report is checked against its manifest and regression policy. An independent coverage publisher selects a successful report from the core
nextbranch and checks its provenance before replacing the live source report.
I use a Panackelty-specific format because ordinary counts don't carry all the evidence this process checks. LCOV tracefiles record line, function and branch counts. Those are useful measures, but our records also preserve source-item identities and the artifact and inventory each record belongs to. They distinguish a known zero from unavailable data, and function entry from function completion. We could export ordinary counts in LCOV form for tools that accept them, but that would leave out detail from the checked report.
The VM observes execution, the compiler connects observations to source, the reader checks the evidence, and the publisher checks what it's about to make public. A test run can't choose its own denominator by reporting only the items it happened to hit.
Coverage is an opt-in observation alongside execution. The accepted source baseline leaves bytecode version 9 unchanged; coverage probes and counters aren't part of ordinary compiled programs. If collection fails, Panackelty reports a collection failure without changing the program's normal result.
Attempts, completions and interrupted runs
I need to know whether a run was merely attempted or completed. Entering a function isn't the same as returning from it, and evaluating an expression isn't the same as leaving it successfully. That matters if an operation traps or a process stops part-way through.
A trap can still leave useful evidence about instructions reached before it. A killed process, crash, timeout or missing session record can leave the evidence incomplete. I don't fill those gaps with zeroes. Before a report claims a complete measurement, it has to establish what ran and that the records are complete.
Each execution gets a fresh session identity. The session records which artifacts may run, admits each execution, then checks the records against that identity and the expected execution tree. Replaying an old record, leaving out an expected child, adding an extra record or changing the registered artifact set prevents a complete report.
These checks make accidental gaps visible. They aren't cryptographic proof against someone deliberately rewriting local files. I treat the reports as reproducible engineering evidence under the stated local workflow, not signed attestations from an adversarial environment.
Covered, known zero and unavailable
The report keeps three states separate because they mean different things:
- Covered: the evidence shows that an eligible source item ran at least once. That still doesn't tell me whether a test checked its result.
- Known zero: the report has complete evidence for the item, but no measured execution reached it. That may point to a test gap.
- Unavailable: the report can't establish whether the item ran. Its source association may be ambiguous, or an execution record may be incomplete or missing.
Unavailable doesn't mean uncovered. Calling it a zero would say I know the code didn't run; calling it covered would invent a hit. If any item is unavailable, Panackelty leaves the complete percentage blank and shows lower and upper bounds instead. The lower bound counts confirmed hits; the upper bound assumes every unavailable item was covered.
What the current source report covers
At the time of writing, the published baseline measures a defined native test corpus, not every test in the repository. Its versioned manifest is the checked-in list of what the report includes. It names the production .panack files eligible for measurement, 14 unit-test roots, 13 positive functional roots and three compiler paths: source checking, disassembly and a byte-identical compiler bootstrap check. That last check rebuilds the compiler through its stages and requires the resulting compiler artifacts to match byte for byte. Test files are executed and identified where needed, but they aren't part of the production-source denominator.
The manifest makes changes to scope visible. A newly tracked production source file doesn't silently enter or leave the measurement; the manifest needs review. Shared imports may be compiled in different contexts, but each source item appears once in the denominator. Hits from distinct executions can still contribute to its result.
The initial corpus leaves out some external-process and death tests, TCP integration, package and release paths, other functional cases, and browser or WASI suites. Some dynamically generated compiler checks also need separate registered batches before I can include them. These are scope limits, not claims that those tests don't matter or that the code they exercise has no coverage. Native C/LLVM coverage remains a separate report for core main; the .panack source report follows core next.
A percentage without its manifest and exclusions is easy to misread. The figures can change when the source tree, denominator or execution corpus changes, even if the behaviour under test hasn't.
What the current baseline says
At the time of writing, the reviewed source coverage baseline sets these floors:
- Compiler: 5,173 / 5,998 start lines; 397 / 429 functions; 5,514 / 6,922 source outcomes.
- Bytecode: 587 / 601 start lines; 60 / 60 functions; 517 / 588 source outcomes.
- Standard library: 72 / 133 start lines; 23 / 33 functions; 33 / 64 source outcomes.
These are floors for this reviewed baseline, not universal targets or a claim that a particular percentage makes software dependable. The accepted collection recorded 31 fresh executions, no unavailable measurements and 68 protected source items. Its report records the commit, manifest, toolchain and source identities so I can see what was measured and when.
The report also requires a hit for selected UTF-8, Option/Result and duration items. The policy records their source hashes and structural IDs, so an edit or deletion can't quietly remove the requirement. Changing the policy needs explicit review.
How coverage helped find a bug
The first assertion batch covered UTF-8 boundaries and malformed sequences, both sides of Option and Result handling, and exact, negative and zero duration ratios. Looking at the coverage gap helped me see which behaviour needed those checks.
The new duration assertions exposed a type-sensitive comparison bug. duration_ratio compared signed ticks with a natural-number zero, and duration_divide could receive a signed zero. Equality is kind-sensitive, so the intended error check could be skipped and the program could trap instead. Comparing two Duration values preserves the intended typed error.
Coverage didn't find the defect by itself. It showed me where execution evidence was missing; assertions made the expected behaviour precise and exposed the wrong result. Mutation checks then confirmed that the tests rejected an overlong UTF-8 sequence, an incorrect fallback value and removal of a duration error guard.
That's how I use the report: a hit tells me code ran, but it doesn't tell me whether a test would fail if that behaviour broke.
Use the report as a guide
When an item is a known zero, I decide whether it deserves a test. A missing error path, boundary case or important alternative usually does. A defensive path that can't occur under the language's rules may need an explanation instead. The report gives me somewhere to look; it doesn't make the decision for me.
When an item is unavailable, I need to fix or explain the measurement gap. Treating it as zero would hide whether the problem is in the test suite or the collector.
Coverage can move for reasons that have little to do with behavioural quality. Splitting a packed line can change the line denominator. A new production function can add an unvisited function. A changed manifest can add or remove measured executions. Panackelty compares each component against reviewed floors and requires changes to scope, exclusions and protected items to be explained. An improvement in one component can't conceal a regression in another.
There isn't a universal percentage that proves a compiler is well tested. I use coverage alongside focused assertions, compiler and VM tests, functional runs, bootstrap checks and mutation tests. Coverage tells me where the test suite went; the other evidence tells me what it checked.
Using coverage in your own project
Panackelty needs a collection system that can follow source through compiler invocations, nested VMs and supported child processes. That's a particular problem. An ordinary application can usually start with the coverage support in its language and test framework.
The questions I had to answer still apply to a web service, a desktop app or a command-line tool. You don't need Panackelty's machinery to make those decisions clear.
Decide what question the report should answer
“How much of the code ran?” needs a boundary. Does the report include production code, tests, generated files or the whole repository? Which test commands and environments contribute? What about background workers, scheduled jobs or child processes?
Write down the scope before comparing percentages. A web service report built from request tests, for example, may miss a queue worker running in a separate process. Passing the service's main test command doesn't mean the worker's code was tested. Put the boundary in the report or its documentation so readers know what the number describes.
Most projects can use their test runner's existing file selection and coverage configuration. A small checked-in configuration or manifest makes the intended scope easier to review, particularly when generated, vendored or platform-specific code needs special treatment.
Choose a measure that matches the risk
Line coverage gives me a map of where execution reached. Function coverage can show code that was never called. Branch coverage can show decisions whose alternatives haven't all run. None of these is automatically right for every project.
For an application, the paths that matter might be a successful and failed request, retry and stop behaviour, permission granted and denied, or valid and invalid input. Choose a measure that helps you see those paths. The most detailed number available isn't always the most useful one.
I count source outcomes in Panackelty because VM-level branches can reflect compiler lowering rather than choices in the language source. Most application teams should use the measures their established tool provides and make clear what those measures count. They rarely need to design a new collector.
Coverage tools also differ in what they count as a line or branch. A percentage from one tool or configuration may not compare directly with one from another. Check the tool's definition before treating the figures as the same measure.
Keep missed code separate from missing evidence
If a tool establishes that a branch didn't run, I can consider it as a test gap. If instrumentation failed, a subprocess wasn't observed or a report is missing data, the result is uncertain. Those call for different actions.
Check how your tool represents files it can't instrument, code excluded by configuration and tests that fail before producing a report. If any of those can be mistaken for uncovered code or disappear from the denominator, document the limit and make it visible in the workflow. Panackelty's explicit unavailable state is one way to do that; another project might use warnings, report errors or separate status fields.
Tie every number to the run that produced it
Coverage changes when source files, test selection, tool versions or configuration change. Save enough provenance to understand a result later: the source revision, test commands, coverage configuration and tool version. If separate jobs or processes contribute, check that the report combines the intended runs and hasn't picked up an old result by accident.
This doesn't require Panackelty's session tickets and byte-level identity checks. For an application, a CI artifact linked to its exact commit and workflow run is often enough. The point is to know what a published report describes.
Worked example: reaching a retry limit
Suppose a service tries a request up to three times before returning an error. The tests cover a successful request and one that succeeds after a retry, but none where all three attempts fail. The report shows the give-up outcome as a known zero.
I would add a test where the dependency fails on every attempt. Then I'd check that the service makes exactly three attempts and returns the expected error. The report should show the give-up outcome as covered; the assertion checks whether the service behaved correctly. Coverage pointed me to a path worth testing, but it didn't decide what the right result should be.
If the dependency runs in a worker the collector can't observe, the outcome is unavailable instead. I'd fix or document that measurement gap before drawing conclusions from the percentage.
When a percentage becomes a target, it's possible to exercise code without checking its effects. A rise is useful when it reflects tests for behaviour that matters. A fall deserves an explanation: perhaps there's a real regression, perhaps the denominator changed, or perhaps the measurement became more accurate.
A short review before sharing a coverage figure
Before I treat a coverage number as a project result, I ask:
- Which source files and test runs are included?
- Which measure is reported, and what exactly does it count?
- Can I tell the difference between code that didn't run and code the tool couldn't measure?
- Can I connect the report to the source revision and test configuration that produced it?
- Which tests check that the covered behaviour was correct?
Those answers make a figure more useful than a larger percentage without context. Panackelty is one detailed example of putting the questions into practice; the same questions can improve reports from much simpler tools.
Inspect the evidence
The live source coverage report shows the latest accepted source measurements and their provenance: the source revision and evidence behind the report. The baseline contract describes the manifest, policy, reproduction process and publication boundary. The inventory contract explains which source constructs are counted, and the collection guide describes counters, sessions and record validation.
To reproduce the baseline, use a clean committed core checkout with Node 24 and the normal native toolchain, then run:
make source-coverage-report-tests
make source-coverage-baseline
The second command refuses to overwrite an existing output directory. The resulting report includes the exact manifest and source, compiler, bytecode and session identities used for that collection.
Conclusion
For me, the value isn't the percentage on its own. It's knowing which code and tests produced it, seeing where the evidence is missing, and having a sensible place to start the next test. Panackelty needs compiler-specific checks to make that work, but the habit is simpler: use coverage to find questions, then use assertions to answer them.